Michael Hotka's
Sudden Ionospheric Disturbance Observing
Results
Building and Installing the Hardware
Observations
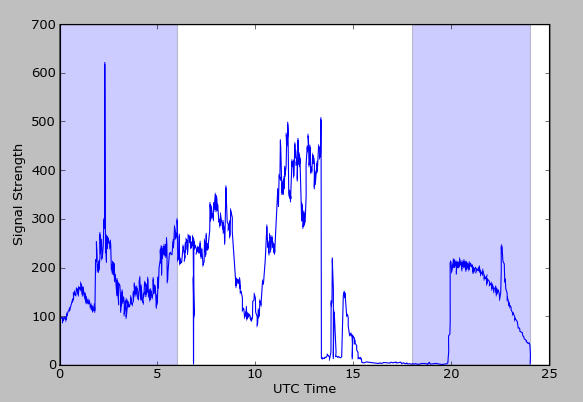
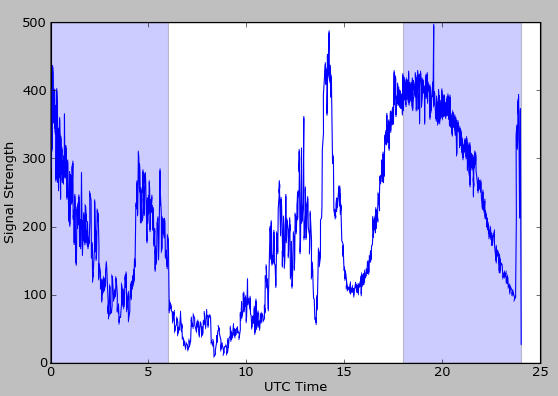
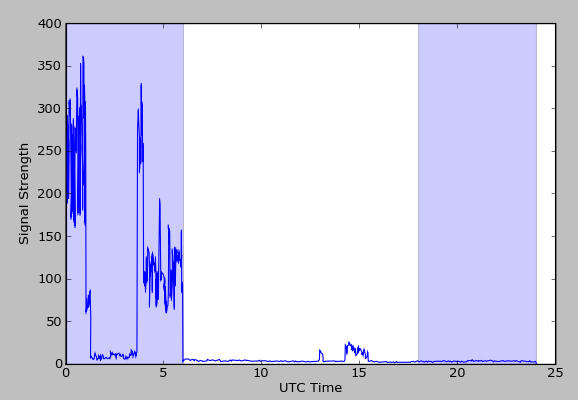
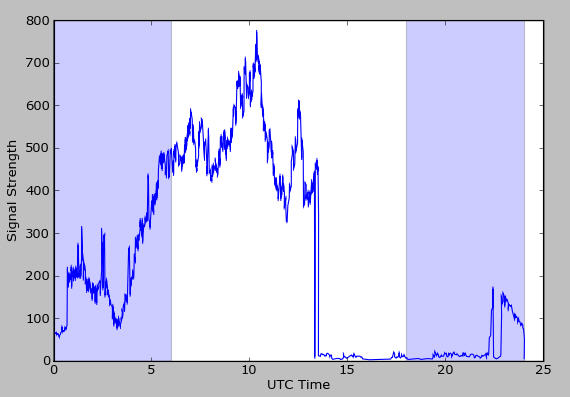
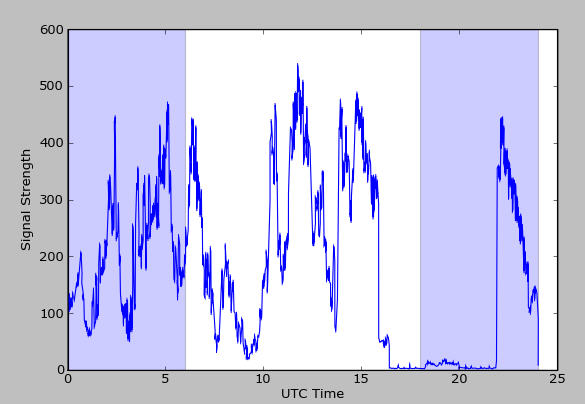
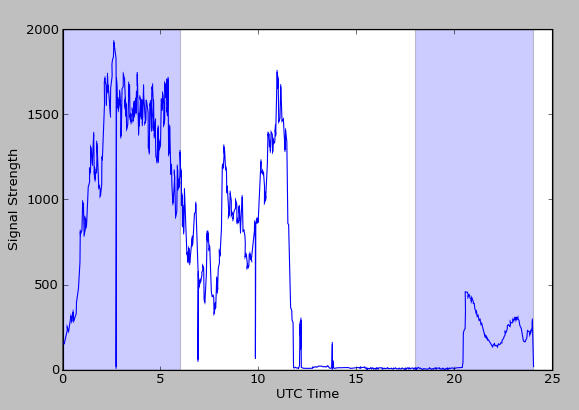
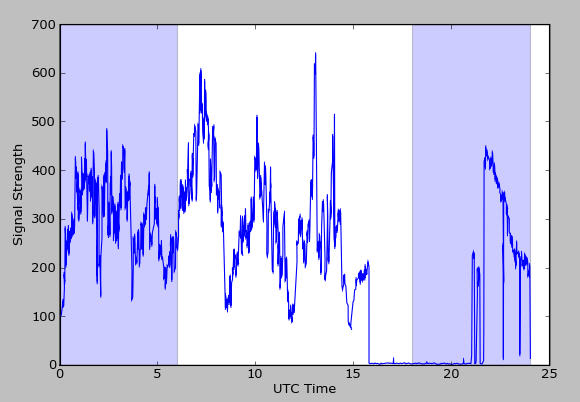
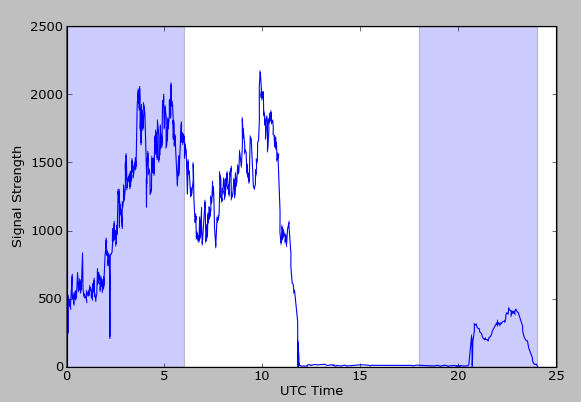
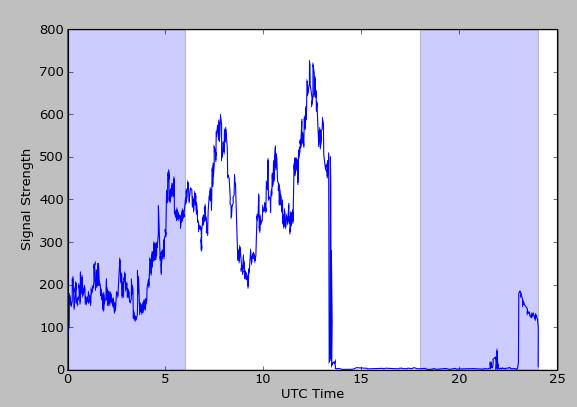
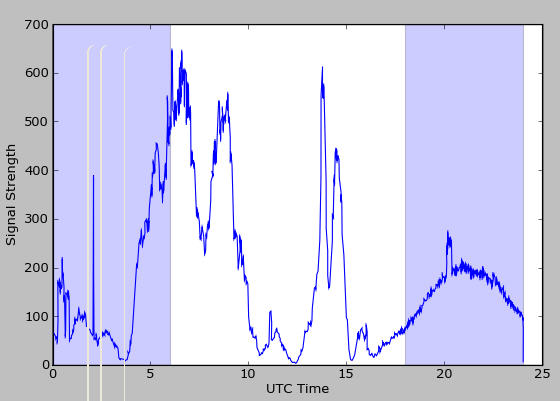
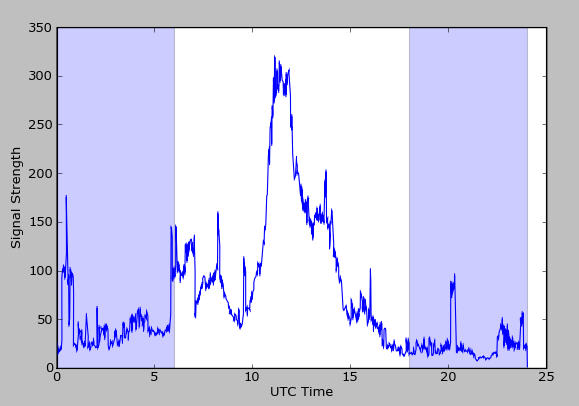
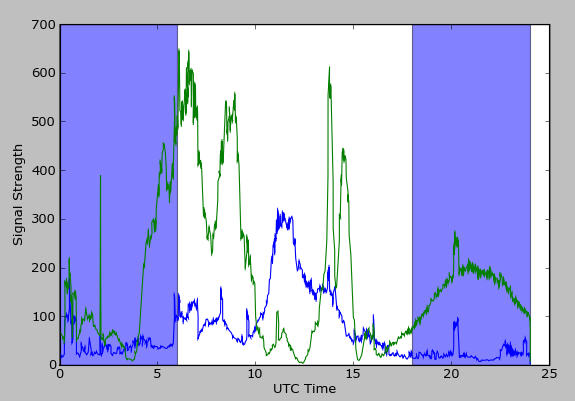
Link to Observation Observation 1 Observation 2 Observation 3 Observation 4 Observation 5 Observation 6 Observation 7 Observation 8 Observation 8.1 Observation 9 Observation 9.1 Combined - NPM is Green and NWC is Blue Observations Combined Observation 10 Observation 10.1 Observation 10.2 Combined - NLK is Blue, NPM is Green and NWC is Red Observations Combined The SID event on 1/23/2016 was over the Pacific and was picked up by Hawaii's and Australia's signals. The Observations Combined shows the plot of 24 hrs of data, showing the concidence of a received SID from the two transmitted signals.
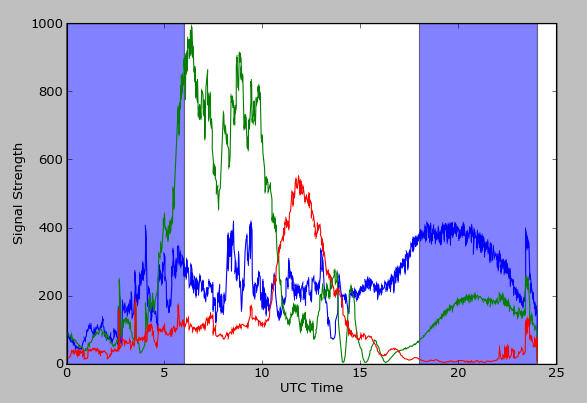
The SID event on 1/24/2016 was strongest over the eastern Pacific, being picked up by Washington's, Hawaii's and Australia's signals. The Observations Combined shows the plot of 24 hrs of data, showing the concidence of a received SID from the three transmitted signals.
Back to Main Astronomy Page